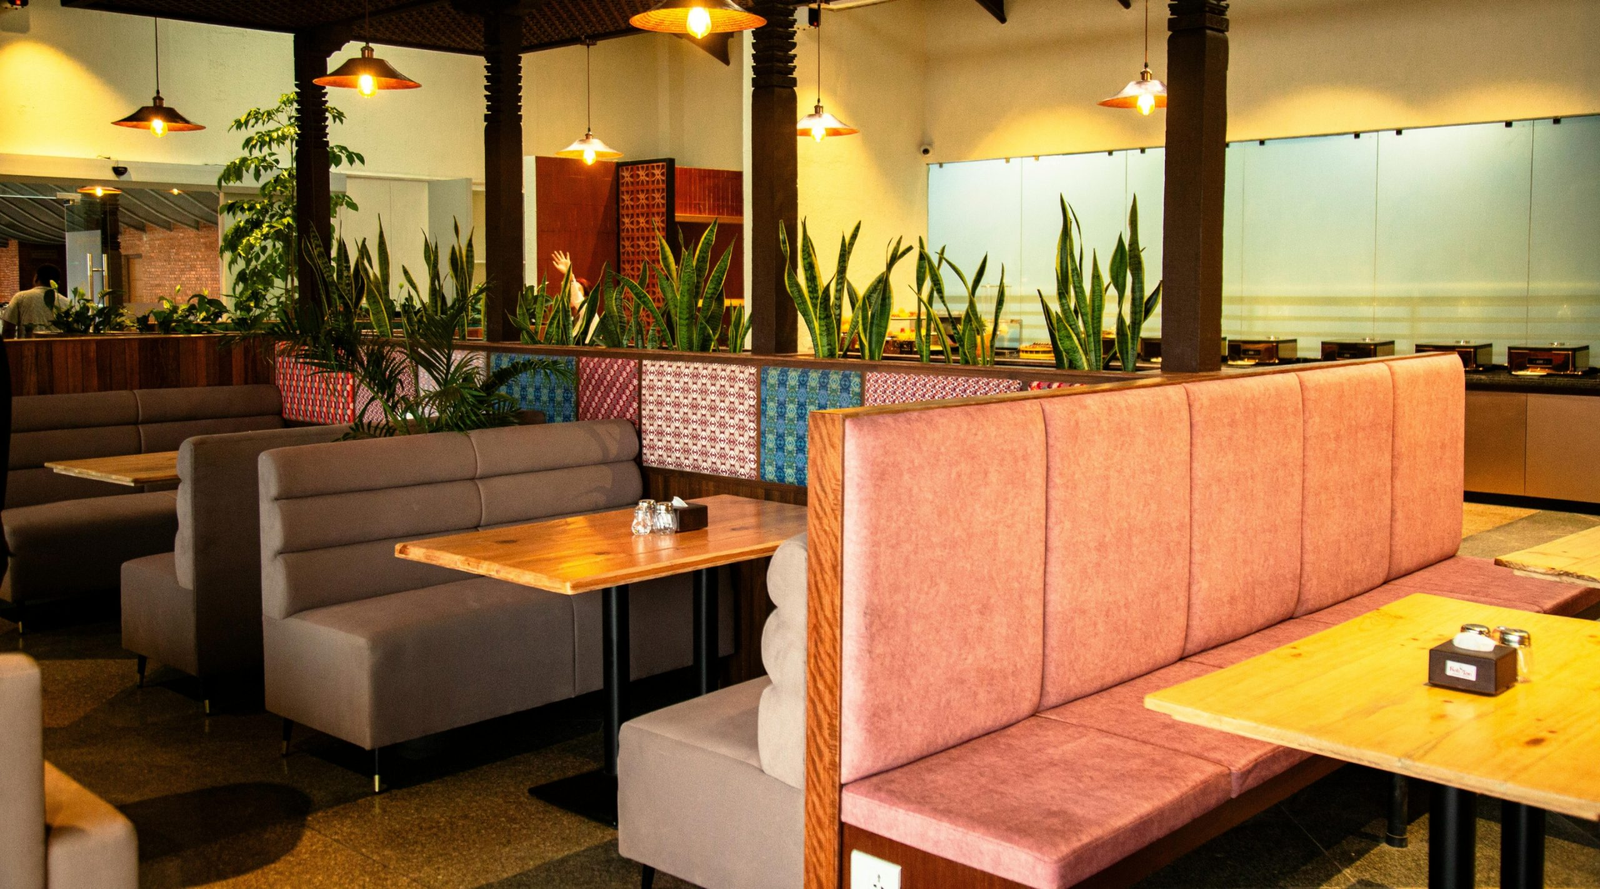
What Restaurant Booths Do to Revenue Per Square Foot
Most operators evaluate booths on the wrong metric. They compare covers per square foot, find that booths lose to loose tables by a clear margin, and conclude the maths is settled. It is not settled, because covers is an input and revenue is the output, and the two diverge more in this decision than in almost any other a restaurant makes.
Run the comparison properly and restaurant booths frequently win on revenue per square foot while losing on seat count, which is a counterintuitive result with a straightforward explanation. Three effects work in the booth’s favor and one works against it, and the balance depends on numbers a venue already has.
Start With What the Booth Actually Costs You
Be precise about the penalty first, because it is real.
Fixed bench seating consumes more floor area per cover than loose chairs. A booth for four occupies a defined rectangle that cannot be reduced, cannot be combined with a neighbour, and cannot seat five when five arrive. Loose tables flex in all three directions.
Occupant load planning under the Life Safety Code uses different net area figures for tables and chairs than for concentrated seating, and the numbers make the point plainly. A room built entirely from booths seats meaningfully fewer people than the same room built from loose furniture.
So the booth starts the comparison behind. Everything after this is about whether it makes the difference back.
Effect One: Party Size
The first effect is the largest and the easiest to verify from a venue’s own data.
Booths attract larger parties. Groups of four and above select them disproportionately when both options are available, and a booth for four routinely seats five because a bench absorbs an extra person and a set of chairs does not.
Larger parties produce larger checks, and not proportionally. A table of five orders more per head than a table of two, because groups order more sides, more rounds and more dessert. That effect alone frequently covers the seat count penalty.
Effect Two: Dwell Time
The second effect is about duration and it cuts both ways, which is why it needs measuring rather than assuming.
Booths hold people longer. The enclosure, the postural variety of a bench and the acoustic separation all extend a visit past the point where a chair would have ended it. That produces the second round, the dessert and the coffee, which are the highest-margin items on most menus.
In a room that turns tables twice a night, longer dwell is pure gain. In a room with a queue at the door, it is a cost. Which one applies is a fact about the venue rather than about the furniture, and it is the single most important input to the calculation.
Effect Three: Section Preference
The third effect is subtle and shows up clearly in section-level revenue data.
Guests offered a choice take the booth. That means the booth section fills first, stays full longest, and is the last part of the room to empty. Loose table sections fill after it and empty before it.
Across a year, occupancy in a booth section runs materially higher than in a loose section of equivalent size. Revenue per square foot is a function of occupancy as much as of check size, and this is where a large part of the booth’s advantage comes from.
The Cost Nobody Puts in the Model
There is one genuine drawback and it belongs in the comparison honestly.
A booth is permanent. It cannot be moved for a private event, cannot be reconfigured for a different party size, and cannot be removed when the room needs to be something else. A restaurant that reconfigures frequently is paying for that rigidity every time.
The Small Business Administration’s guidance on calculating costs is a reasonable template for pricing that inflexibility. The honest way to do it is to count the events per year the room cannot host and value them.
The Accessibility Requirement Is a Design Input
There is also a constraint that is not optional and gets treated as an afterthought.
Under the 2010 ADA Standards, a proportion of dining surfaces must provide compliant knee and toe clearance and be dispersed rather than clustered. Fixed benches provide neither, so accessible positions have to come from freestanding tables placed through the room.
That is a floor area cost and it should be in the model from the start rather than discovered afterwards. Rooms that plan for it get accessible seating in the good section. Rooms that do not get it in whatever space is left.
How to Run the Comparison on Your Own Room
For an operator with a real decision to make and real data available:
- Section-level revenue and covers for the last twelve months, not the last month
- Measured floor area by section, including the circulation the section requires
- Average party size by section, since this is where most of the difference lives
- Occupancy rate by section by day part, which is usually the biggest surprise
- Events per year the room could not host because of fixed seating
- Accessible position count and where those positions actually sit
What the Numbers Usually Show
Two patterns recur when operators run this properly rather than arguing about it.
The first is that booths win on revenue per square foot in rooms that do not turn hard, and lose in rooms with a permanent queue. The crossover is genuinely close, and it moves with the average check.
Beyond that, most rooms are better off mixed than committed either way. A perimeter of booths with loose tables in the center captures the party size and occupancy effects where they are strongest. It also keeps the flexibility where it is needed and gives accessible positions somewhere decent to go.
The metric to stop using is covers per square foot. It is the number that made booths look expensive, and it has been answering a question nobody was actually asking.